MONITOR YOUR BUSINESS PERFORMANCE: VIEW IMPORTANT KPIs, TRENDS, AND PROGRESS REPORTS WITH ONLINE DASHBOARDS
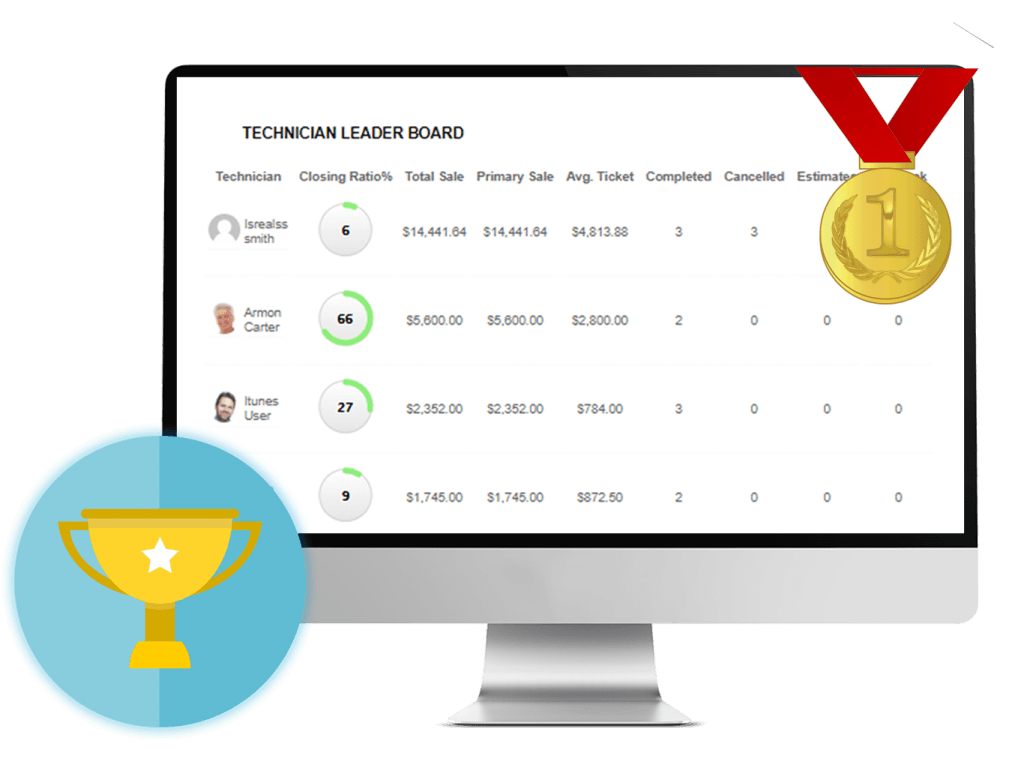
Employee Sales Leader-board
Track employee performance by using real data to define a points-earning system for each captured sale, completed job, or any other sales activity.
- Find out which technicians are outperforming others
- Display ranks according to earned points
- Overall sales efforts of employee

Better insights, Better performance!
Make your business data driven using comprehensive field service analytics on dashboard.
E-strats lets you monitor and analyze your key performance indicators and other quantitative business in seconds without having to rely on complicated processes.
The data transparency and interactivity in web based dashboard can help you boost your performance by acting upon best opportunities for
- Client and customer acquisition
- Process optimization
- Long-term growth.
From total jobs completed to technician’s performance, it can display metrics that mean the most to your business.
Visualizing All of the Data, at A Glance
Quick analysis of big data and data visualization provide you with real time results that can help you in making intelligent business decisions.
The dynamic dashboard has all the useful reports that provide up-to-date and useful information for quick insights into:
- Estimating costs
- Sources of marketing
- Average income, expenses and expenditures
- Sales progress and more than 10 types of such reports
These features provide a summarized overview of the overall functionality of the field service management software for better cost management, workforce management and marketing strategies.

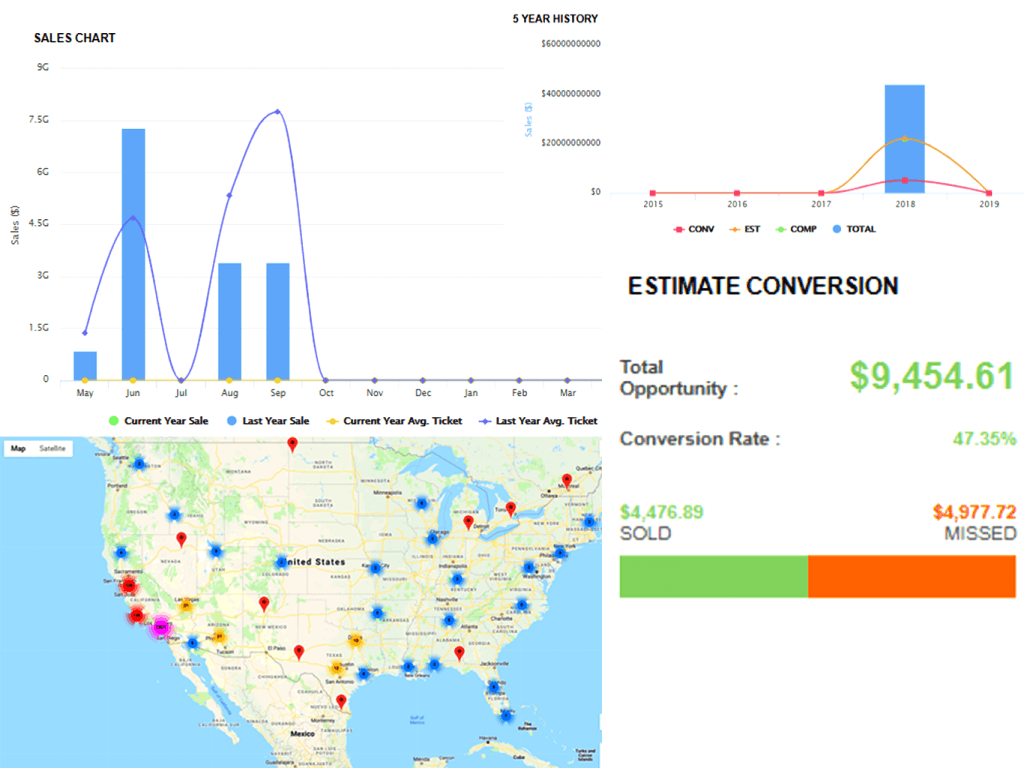
Heat maps, bar charts, pie charts and more!
Data visualization through charts and heat maps gives you the advantage of having a clearer look at the data with business intelligence analytics that can prove beneficial to your field service company.
View daily, monthly and weekly performance of your all the important KPIs of your business in both graphical and statistical formats.
Benefit from features that help you
- Improve service quality
- Enhance engagement with customers in innovative ways
- Earn revenue and more
Keep track of all the progress and performance of your workforce.